Open Resmon Analyzer · All tool guides
Before you start
Plain-text resource monitor output with one resource per line and CPU values ending in ms.
Step by step
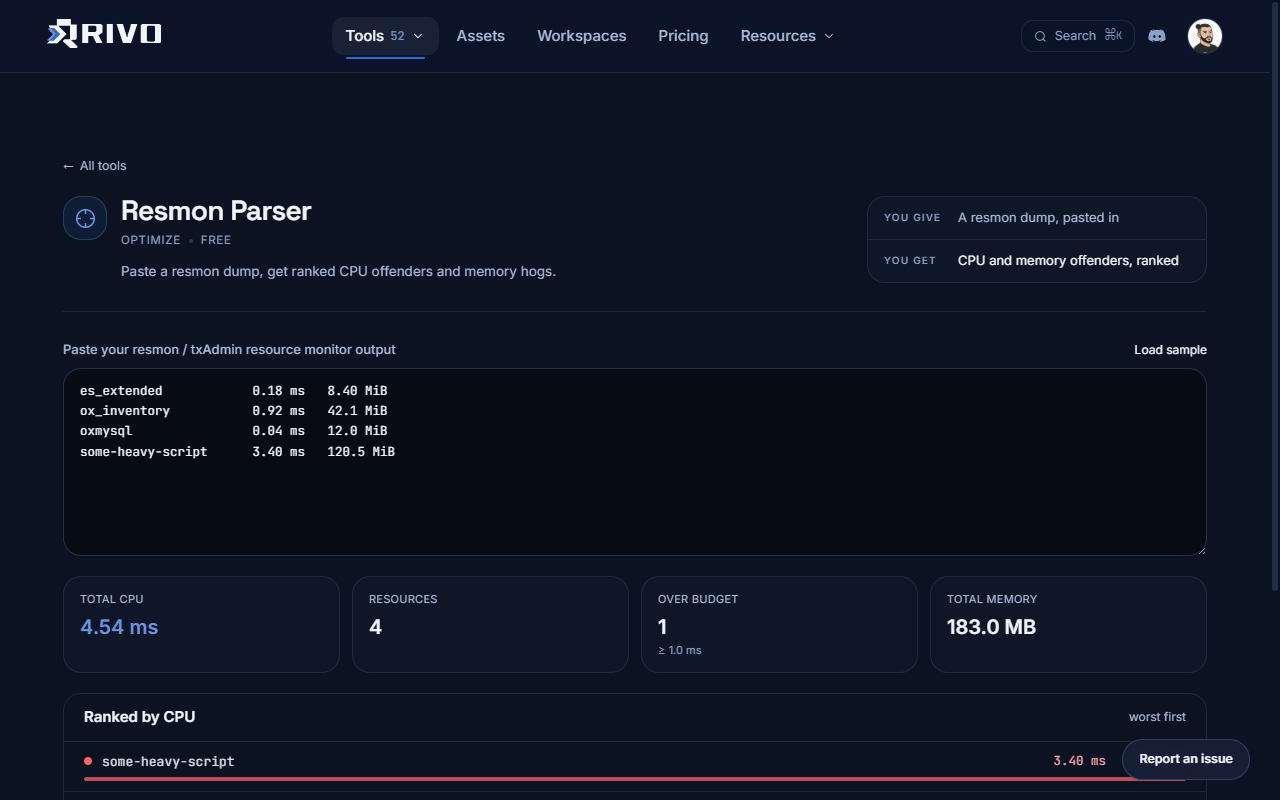
- Paste the monitor output or choose Load sample.
- Read Total CPU, resource count and the Ranked by CPU list.
- Investigate the highest rows under the same gameplay conditions used for the capture.
- Capture again after changes and compare like-for-like observations.
What you get
A ranked report of the supplied text. It does not connect to your server or record live performance.
Troubleshooting
If no rows are recognised, include resource names and CPU values with ms units. Different workloads or client/server captures are not directly comparable.
Try it with sample data
Choose Load sample. The four sample rows total 4.54 ms; some-heavy-script ranks first at 3.40 ms. Change that row to 0.40 ms and the total becomes 1.54 ms, with ox_inventory first. These are demonstration values, not measurements of your server.
Next steps
Read Installing and checking results before replacing a working resource. For access, failed jobs or download problems, see Troubleshooting tools.